


That's Beside The Expected Point


To see us through (help us cope with) the international break, similar to our piece on Pontus Jansson, we’re going to be putting out odd data snippets which we hope you will find interesting.
Expected Points Tables - xG & Non-shot xG
As they grow in popularity and acceptance increases, you may find yourself stumbling across more and more “Expected Points” or “Justice League” tables.
There are many ways to produce these types of tables, ranging from crude measures to more complicated techniques, but they all share an aim of ranking teams by their underlying performance instead of actual points won.
Interestingly, the ability to not only produce team strength data and then decide how to rank teams in a closer fashion to what was actually happening on the pitch is how Brentford Owner Matthew Benham managed to beat gambling markets for so long.
We’re not quite as sharp as Matthew (no laughing), but we do know a bit about these tables, so here's ours.
First up is an Expected Points table derived from xG shot data provided by the brilliant people over at FiveThirtyEight. We can use their match level Expected Goals numbers to attribute points to each team in each match based on shot quality and the level of dominance over their opponents.
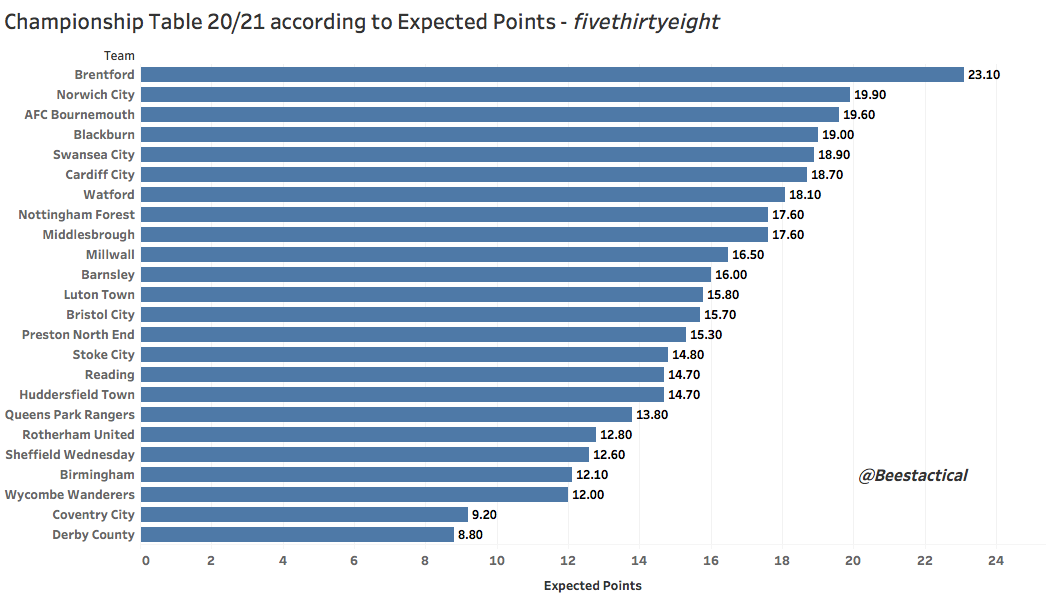
Note Brentford riding high at the top of the table. According to fivethirtyeight’s xG data, there’s a fair gap between Brentford and second place Norwich. A brief way to interpret this is Bees are almost always heavily dominant in terms of their xG created and conceded. Infogol’s Expected Goals model, for instance, has the home match 2-4 defeat vs Preston as the only time a team has cumulatively created higher value chances than Thomas Frank’s Bees. It is the regularity of that dominance that transfers into leading this table.
A quick check at the bottom of our “xG Justice League” we find Philip Cocu’s Derby County. The early signs for Rams are not good and it isn’t wild to conclude that without drastic changes to the team or how they are going about creating and conceding chances, Derby are in a bit of trouble.
Just above Derby in 22nd are Wycombe, Brentford’s next opponents. It's a tie that is describable as David v Goliath in underlying performance terms, but football is a funny old game, as they say, and there are signs that Ainsworth’s team are rather efficient in how many chances they’re creating relative to possession and the expected value of those fleeting efforts.
Next up is another table, this time produced using match level Non-shot Expected Goals totals.

If you’re unfamiliar with the term “Non-shot xG” fivethirtyeight explain their workings below.
Non-shot expected goals are an estimate of how many goals a team “should” have scored based on non-shooting actions they took around the opposing team’s goal: passes, interceptions, take-ons and tackles. For example, we know that intercepting the ball at the opposing team’s penalty spot results in a goal about 9 percent of the time, and a completed pass that is received at the center of the six-yard box leads to a goal about 14 percent of the time. We add these individual actions up across an entire match to arrive at a team’s non-shot expected goals.
So, similarly with our first table, we can take the match level Non-shot expected goals data and use the same technique as earlier to produce a league table. A quick way to think about this table is it has the aim of ranking teams in order of how well they do “everything” excluding shooting.
Being top of both of these tables is a surefire sign that you’re doing something right as a coach and that is the case for frontrunners Norwich City’s Daniel Farke.
Not only are Norwich not content with riding high in our shots table, their process in how they are moving the ball into the areas to take good shots is sound. In fact it’s the best according to fivethirtyeight's model capturing all of those extra actions.
Brentford defy their actual league position of…. (you’ll have to remind us), and are the best of the rest and lead the pack chasing down Norwich and Bournemouth.
At the other end of the scale and propping up the Non-shot xG league table are some of the usual suspects and others that might surprise you.
Birmingham City and Sheffield Wednesday are currently built to play the game in a different way to the front runners. Relying on a deeper counter-attacking style and lots of crosses, these sides are not making high value short passes around their opponents 6 yard box, relying instead on mistakes and direct play.
Surprisingly, Reading are one of the leagues lowest scorers in terms of Non-shot xG points and that may confuse many looking at their lofty actual league position of, checks notes, 1st.
Reading started the season like a train and were scoring goals and not conceding at an extreme rate relative to their underlying performance. The Royals would go long periods in games without the ball, defend chance after chance and then go up the other end and score! Three heavy defeats on the spin has been coming but even without delving into the data their league position didn’t look right. Looking at the data, their creativity strength is that of a team that could be fighting a relegation battle in our performance table.
Talented players have been known to make a mockery of these tables and individual skill has a lot to answer for when propelling average teams up to the summits of the league.
Things, however, do tend to catch up with lucky teams and that’s really the aim of these tables. Remove noise, measure repeatable performance.
Are a team like Reading FC in a false position and likely to fall away when the going gets tough or have they found a formula for a sustained high level assault on the division?
Table your answers below.
Happy Reading! The international break will be over soon, we promise. And don't forget to share Bees Tactical with anyone you think may be interested.
https://www.patreon.com/BeesTactical
https://beestactical.substack.com/people/5760479-bees-tactical
https://twitter.com/beestactical

